
THE WIDE ANGLE: Princeton's 64 Telescopes Just Broke the Comet Model
A 12-sigma anomaly, inflated error bars, and the 5.6-sigma flash they deleted from the official record.

DATE: March 2, 2026
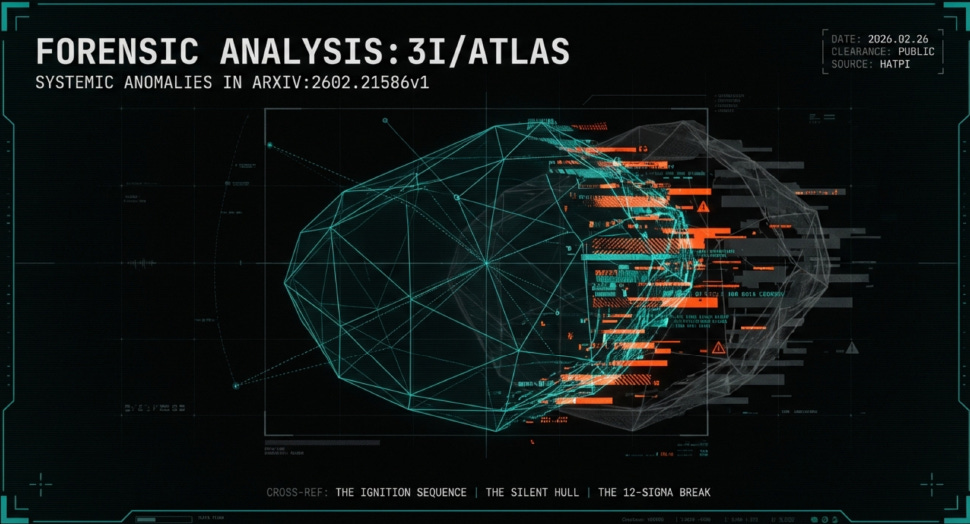
SUBJECT: FORENSIC ANALYSIS OF ARXIV:2602.21586v1 // HATPI PRE-PERIHELION PHOTOMETRY OF 3I/ATLAS
CROSS-REF: [THE IGNITION SEQUENCE] | [THE GHOST COMA] | [THE HEARTBEAT] | [THE SURGE] | [THE SPHEREx INTERCEPT] | [WE ANALYZED THE SPECTRUM DATA]
CLEARANCE: PUBLIC
WHAT THIS PAPER CHANGES
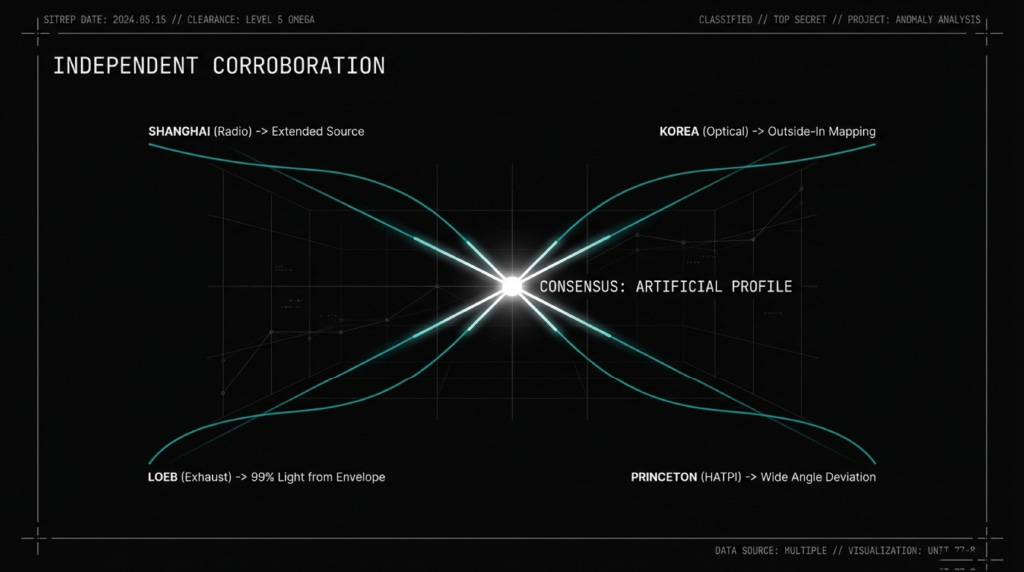
Four teams have now independently confirmed the exact same thing.
Shanghai heard it in the radio data. Korea mapped it in the optical. Loeb measured it in the exhaust. And now Princeton—using the largest single-instrument dataset ever collected on 3I/ATLAS—has confirmed it from a completely different angle.
The exterior of this object is driving the interior. Not the other way around.
Every scientific paper frames it differently to avoid stating the obvious. Shanghai called it an “extended source.” Korea showed the gas appearing “outside-in.” Loeb proved that 99% of the light comes from the exhaust, not the hull.
Princeton just measured it the simplest way possible: they widened their camera lens. And they found that the more of the outer structure they included in the frame, the faster the object was brightening.
That is the exact opposite of what a melting snowball does.
Every team documents this anomaly. Every team explains it away in isolation—blaming “aperture effects,” “grain sublimation,” or “coma contamination.” Nobody runs the combined math. Nobody connects their findings to the three other teams that found the exact same thing.
This paper is the widest window anyone has opened on 3I. Here is what is actually on the other side.
THE INSTRUMENT
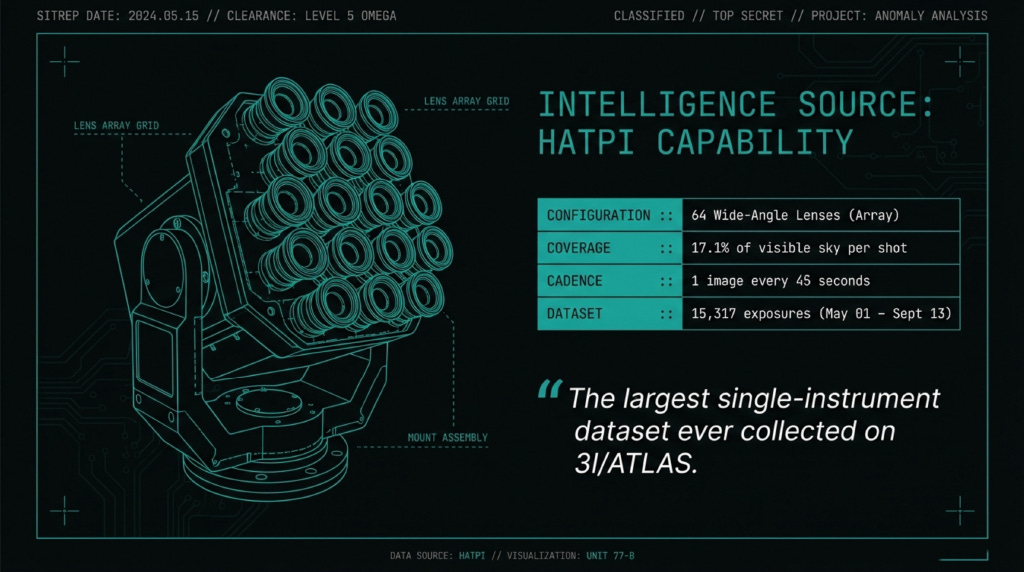
HATPI is not your average telescope. It is a massive array of 64 wide-angle lenses at the Las Campanas Observatory in Chile. It snaps an image every 45 seconds, covering a staggering 17.1% of the visible sky in a single shot. It is a machine built to catch anything that moves or changes.
The Princeton team extracted observations of 3I spanning from May 1 through September 13, 2025. Forty-six nights. 15,317 individual exposures. After aggressive quality cuts, 7,294 clean measurements survived.
This is the biggest pre-perihelion light curve anyone has published. The data collection is meticulous. The instrument is world-class.
The problem only starts when they try to force the data to act like a comet.
THE WINDOW
Here is the core concept you need to understand, because it is the key to everything in this paper.
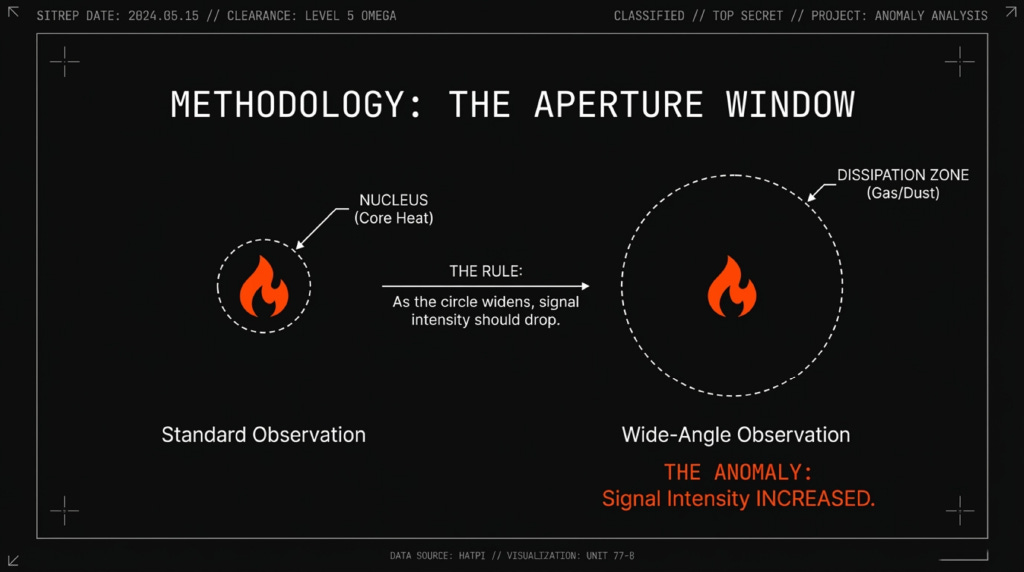
When astronomers measure a comet’s brightness, they don’t just point and click. They draw a digital circle around the object on their image — called an aperture — and add up all the light inside it. Draw a small circle, and you mostly measure the solid nucleus. Draw a big circle, and you capture the nucleus plus the massive cloud of gas and dust trailing behind it.
Think of it like measuring the heat from a campfire. You could hold your thermometer right next to the flames (small circle). Or you could hold it ten feet away and measure the warmth radiating outward (big circle).
If the fire is the only heat source, both measurements tell you the same story. The flames are hottest, the surrounding air is cooler, and the signal weakens the further out you go.
Now imagine you widen your measurement circle, stepping ten feet back from the fire, and the temperature actually goes up. That means the heat isn’t coming from the campfire. Something out there, beyond the flames, is generating its own energy.
That is exactly what HATPI found.
Other observatories, like the Nordic Optical Telescope (NOT), used a tight measurement circle—about 10,000 kilometers across. HATPI used a massive one: 70,000 kilometers. Seven times more sky.
When astronomers looked through the small window, 3I appeared to be brightening at a normal, expected rate. But when Princeton analyzed the wide window, the brightening rate skyrocketed.
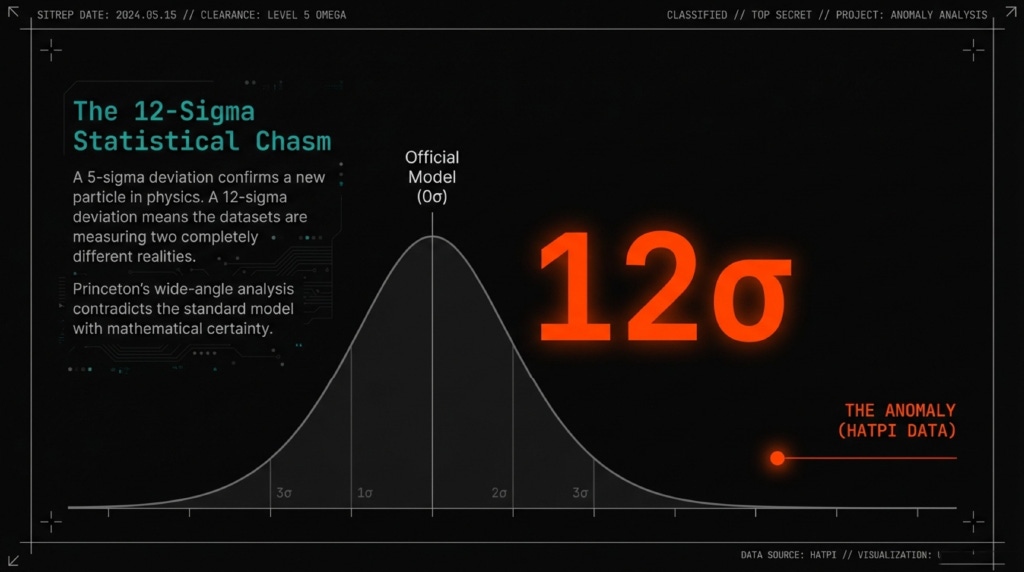
This wasn’t a subtle shift. It was a 12-sigma discrepancy. In particle physics, a 5-sigma break is enough to claim the discovery of a new fundamental particle. A 12-sigma break is a statistical chasm. It means the two datasets are effectively measuring different objects.
And the trend doesn’t stop. When the authors pushed their window even wider—out to 80,000 kilometers—the brightening rate climbed even higher. More outer structure, faster brightening.
THE SENTINEL ASSESSMENT:
The outer envelope of 3I/ATLAS is gaining luminosity faster than the inner core.On a normal comet, the nucleus is the engine. Ice melts off the surface, expanding outward, and the signal weakens with distance. Widening your measurement window should show a slower brightening rate, because the outer material is diluted and cooling.
3I does the opposite. The wider you look, the faster it brightens. The extended structure isn’t coasting on whatever the nucleus throws off. It is outpacing it.
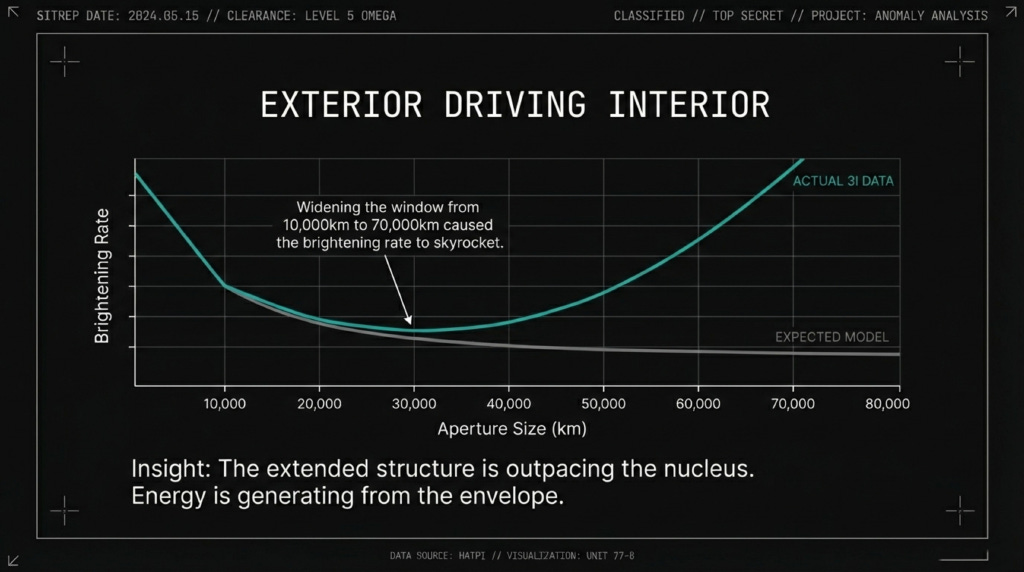
The Princeton authors attribute this entirely to their telescope picking up “extended coma,” framing it as an instrumental quirk. But an “artifact” that scales perfectly with window size, reproduces across every test, and produces a 12-sigma break from every other telescope on Earth isn’t an artifact.
It is a signal.
THE FUDGE FACTOR
So how did the researchers make this highly anomalous data fit a standard comet model?
They padded the margins of error.
Buried in Section 3 is a staggering admission: the data didn’t fit the comet model, so the authors artificially inflated their own error bars until the mathematical discrepancy disappeared. They added “a separate error term” to the data to force the puzzle piece into the slot.
Here is how much extra, artificial error they had to inject to make the comet model work:
HATPI: 0.33 magnitudes
TESS: 0.30 magnitudes
ATLAS-c: 0.24 magnitudes
ZTF-r: 0.16 magnitudes
NOT-R: 0.14 magnitudes
Notice the pattern. HATPI and TESS—the two instruments with the broadest field of view and the most frequent observations—required the most padding. The instruments that see the most need the most blinders to make 3I look normal.
THE SENTINEL ASSESSMENT:
Injecting 0.33 magnitudes of artificial error into a dataset is enormous. It means the HATPI telescope detected systematic behavior that no natural comet model can explain—and this is after they already threw out over half of the raw observations.If your GPS says you are in Kansas but you are staring at the ocean, you don’t add a ±500 mile error bar to your GPS until the map “works.” You question the map. The math is screaming that the comet model doesn’t fit this object. The authors chose to muffle the scream.
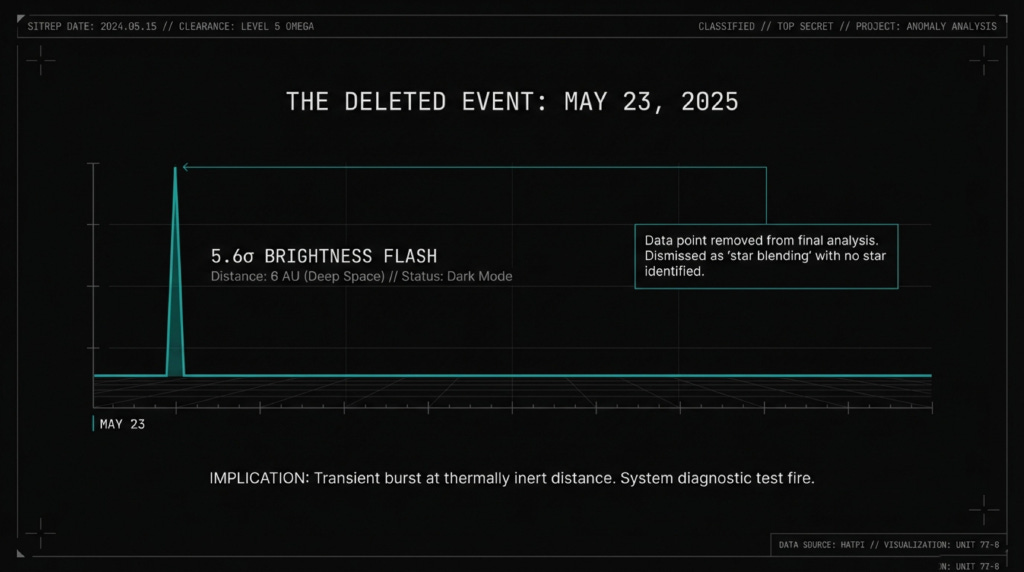
THE SCRUBBED FLASH
This is the finding that almost didn’t make the paper.
3I/ATLAS was officially discovered on July 1, 2025. But because the HATPI telescope constantly photographs massive chunks of the sky, the Princeton team was able to dig into their pre-discovery server archives to see if their cameras accidentally caught the object months earlier.
They did.
Tucked into Section 2.7, in a methodology paragraph most readers will skip, is a massive admission. On May 23, 2025, while digging through these archives, HATPI detected 3I.
According to their own models, the object should have been incredibly faint. Instead, it was 5.6-sigma brighter than expected.
Let that sink in. A 5.6-sigma brightness spike. In any other field of science, that is a career-making discovery. In this paper, it gets you deleted from the dataset.
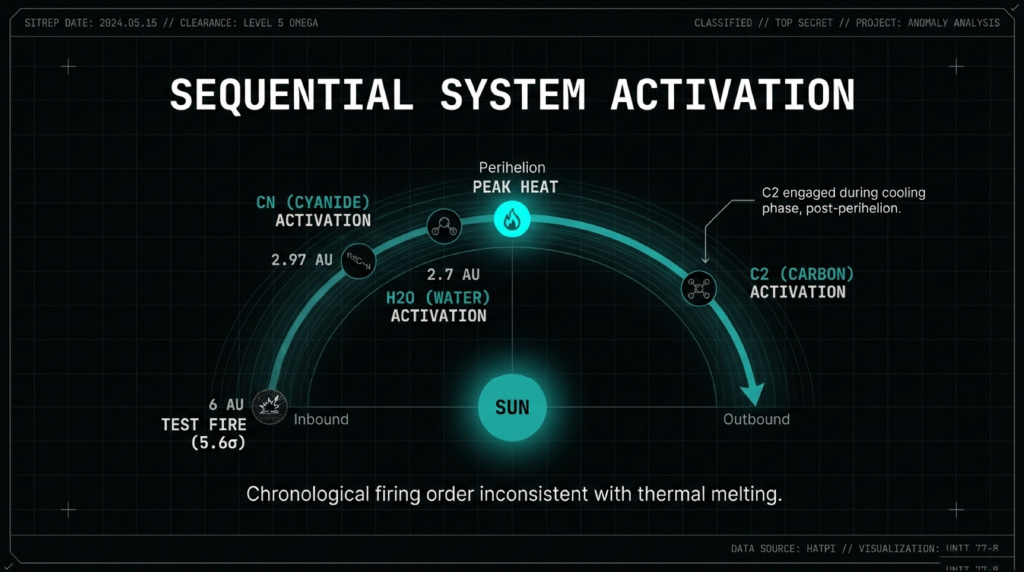
On May 23, 3I was nearly 6 AU from the Sun—deep in what we’ve called the dark mode phase, months before its gas systems ignited. At this distance, the object should be thermally inert. A frozen rock drifting in the dark. Nothing should be happening.
The authors’ justification for scrubbing this data point? The sky was crowded, and they claim blending with background stars “may have” contaminated the measurement.
Note the language. “May have.” Not “did.” They had catalogs of all the variable stars in that region. If a specific star was responsible for the massive flash, they could have named it. They didn’t.
THE SENTINEL ASSESSMENT:
We are not claiming this is proof of a specific technology. We are pointing out that a 1-in-45-million brightness anomaly was scrubbed from the final analysis without identifying the actual source of the light.If you are running system diagnostics before a main engine ignition, that is what a test fire looks like. A massive, transient burst at a distance where no natural thermal process should produce light, followed by an immediate return to baseline. Then, silence for months—until the primary systems switch on at 2.97 AU.
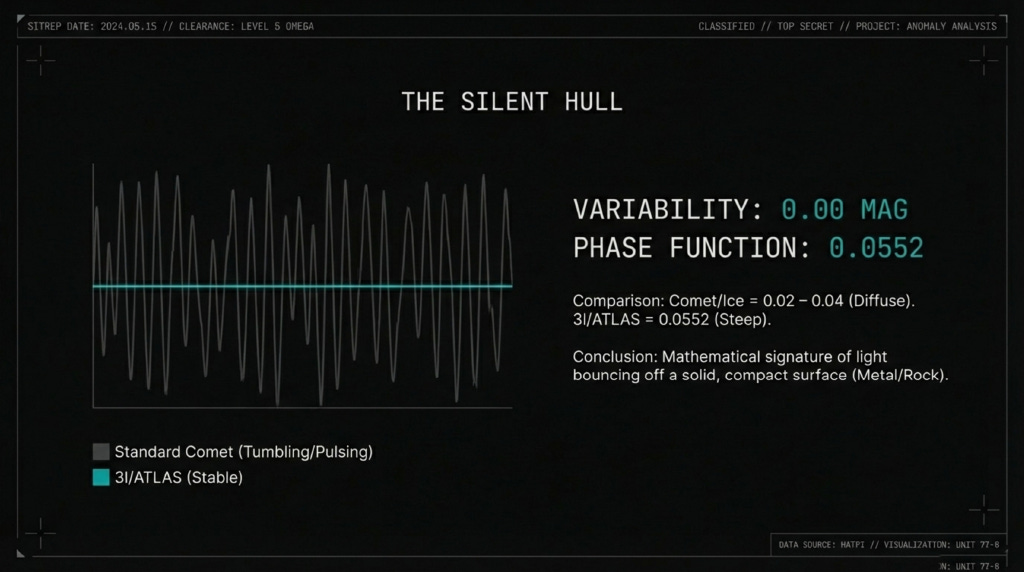
THE SILENT HULL
Once 3I was bright enough to measure clearly, the Princeton team examined twelve straight nights of data looking for short-term flickering or pulsing.
They found nothing. Not a single brightness change above 0.2 magnitudes within any given night.
This is now the third independent confirmation of 3I’s anomalous stability:
SPHEREx: Less than 15% variability across 15 days. The SPHEREx Intercept
Santana-Ros: Detected a 16-hour rotation signal in July. Once the coma took over, the signal didn’t just fade. It completely vanished.
HATPI: Twelve nights. Zero intra-night variability.
THE SENTINEL ASSESSMENT:
A tumbling, outgassing comet should pulse. As the rocky nucleus spins, different icy vents face the Sun, and the brightness oscillates like a lighthouse through the fog.3I’s envelope shows no pulse. The cloud is completely decoupled from whatever is underneath it. Extreme brightness combined with extreme, flatline stability is the signature of a synchronized, artificial system—not a chaotic blizzard of disintegrating ice.
The paper also quietly reports a specific light-scattering value (a phase function of 0.0552). They published the number, but offered no interpretation. Normal comets fall between 0.02 and 0.04. 3I’s value is up to 75% steeper than normal. That is the mathematical signature of light bouncing off a solid, compact surface—like metal or rock. It perfectly matches the opposition surge Hubble detected in January.
THE SEQUENCE EXTENDS
One final finding is dropped into Section 3 without any fanfare.
During the inbound heating phase, 3I released Cyanide (CN), Nickel, and Iron. But the Princeton team confirmed there was no Carbon (C2) in the envelope. However, they note that post-perihelion data from another team shows that C2 has suddenly appeared.
C2 was absent while the object was heating up. It appeared while the object was cooling down.
THE SENTINEL ASSESSMENT:
This extends the sequential activation pattern we documented in The Ignition Sequence.
Pre-2.97 AU: Nothing. Dark mode. (Except for the scrubbed May 23 test fire).
2.97 AU: Cyanide activates.
~2.7 AU: Water activates.
Post-perihelion: C2 appears.
Four distinct chemical stages. Each triggered at a specific distance threshold. If this was a melting snowball, the hottest moment (closest approach to the Sun) should produce everything at once. A new chemical appearing after the peak heat implies a secondary system engaging on the way out.
THE PATTERN
Strip away the academic framing. Here is what the Princeton team actually documented:
An object that brightens faster from the outside than from the inside.
A comet model so broken it requires massive injections of artificial error just to function.
A 5.6-sigma flash in deep space, scrubbed without a definitive source.
A rock-solid envelope with zero rotational pulse.
A light-scattering signature of solid rock or metal.
A new chemical species turning on as the object cools down.
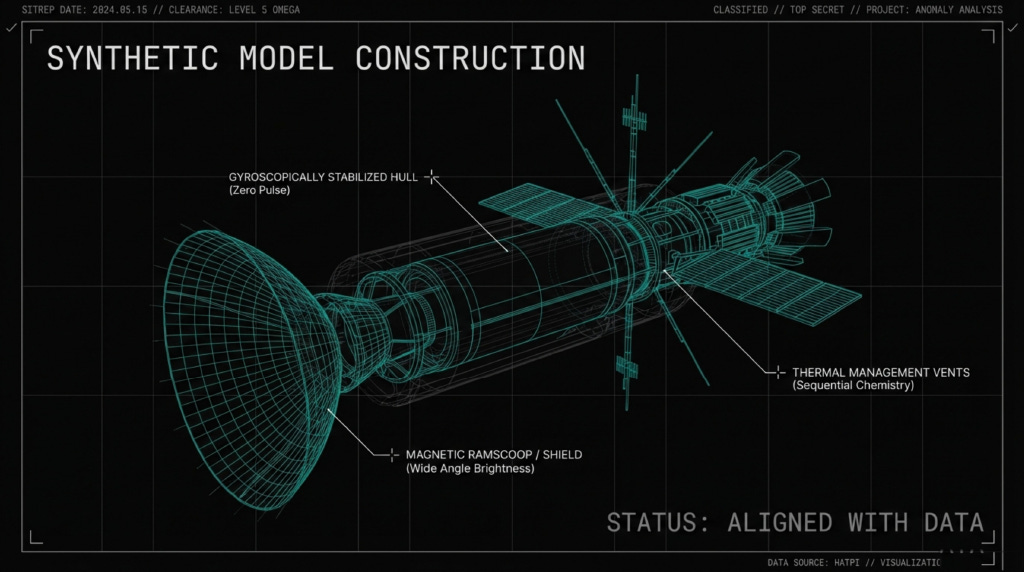
Look at those points again, not as natural phenomena, but as engineered features: The “coma” is an actively generated magnetic shield or ramscoop. The lack of rotation is a gyroscopically stabilized hull maintaining its attitude. The sequential chemistry is an active thermal management system purging coolant at peak heat. And that deleted 5.6-sigma flash? A deep-space diagnostic test fire before the main engines engaged.
Every single piece of data is in their paper. The Princeton team documented every anomaly. They just filed every finding under “instrumental artifact” or “unusual composition” rather than connecting it to the three other teams that found the exact same pattern.
The data is excellent.
The framing is the cover-up.
Fourteen days to Jupiter.
Keep looking up.
— The Sentinel
*** Share this investigation. The Suppression Gradient documented what happens when this coverage reaches platforms that don’t want you reading it. Every share, every restack, every forwarded link is a data point against the gradient.
If you’ve read the paper and see something we missed—or something we got wrong—we want your data.
Previous briefings: [The Ignition Sequence] | [The Ghost Coma] | [The Heartbeat] | [The Surge] | [The Three Days of Darkness] | [The SPHEREx Intercept] | [The Silent Edit] | [The Glomar Confirmation] | [CONFIRMED: The TESS Contingency] | [The Suppression Gradient] | [The December Intersection] | [We Analyzed the Spectrum Data]
Edit: TY to u/XYZ555321 for pointing out we got the date wrong. It originally said 18.
This shit is creeping me out, dude. Is this next...: "My God, it's full of stars!"
Excellent data collection and article, friend.
With all the truly horrific crap happening on earth, just the thought of some "thing" being tracked and reaching Jupiter is an exciting diversion!